by admin | Dec 26, 2018 | Blog
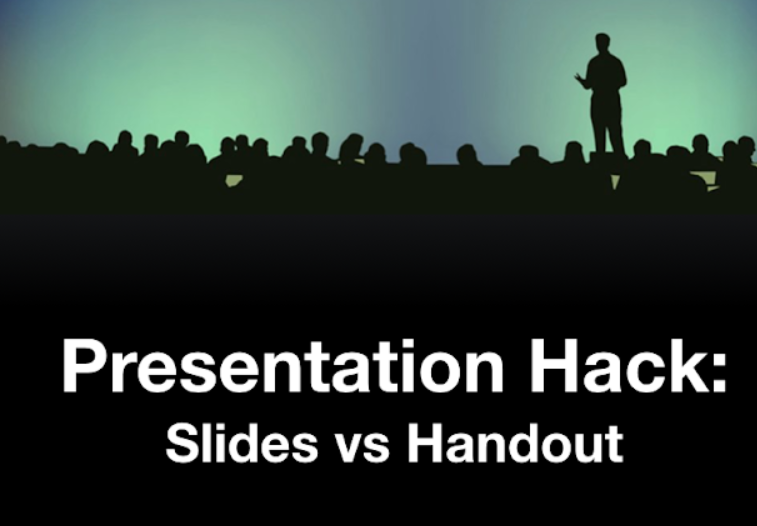
Reading Time: < 1 minuteA handout can be defined as a piece of printed information that is provided, free of charge, especially to accompany a lecture or advertise something. Handouts are often considered a vital part in the corporate setting to tell more about...

by admin | Dec 24, 2018 | Blog
Reading Time: 2 minutesGIFs are the happy medium between images and videos. A few years ago, using GIFs in presentations would have seemed quite unprofessional. However, with the emerging social media trends and the advancements in technology, using a GIF in your...
by admin | Dec 21, 2018 | Blog
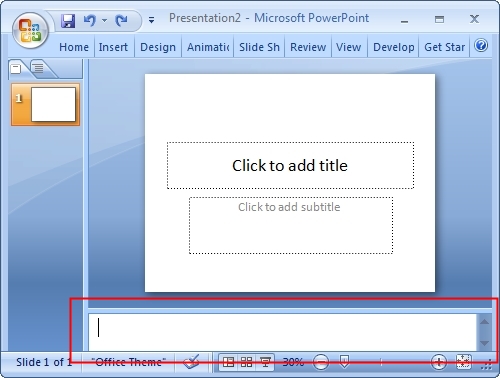
Reading Time: 2 minutesSpeaker Notes in PowerPoint help you remember important points such as key messages, stats or figures while you give your presentation. The speaker note section is generally at the bottom of your screen. You could use the speaker notes to add...

by admin | Dec 19, 2018 | Blog
Reading Time: 2 minutesToday’s generation is the internet generation. We live in a mobile- based culture where everyone from drivers to vegetable vendors now a days have mobiles. Various audience, for the sake of convenience prefer to have their presentations on their...
by admin | Dec 17, 2018 | Blog
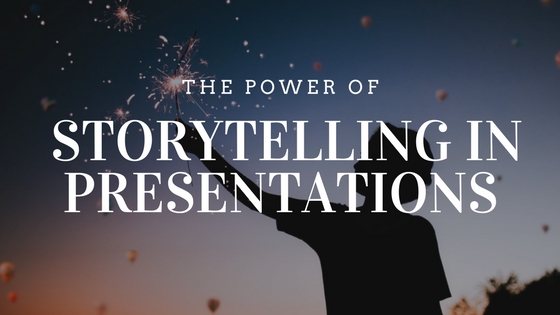
Reading Time: 2 minutesIt is said that stories engage seven parts of the brain whereas facts and figures engage only two. However, these days for presentations, most people rely on facts and figures and do not involve stories. Maybe because facts and figures are to...
by admin | Oct 24, 2018 | Blog
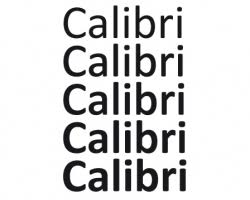
Reading Time: 3 minutesWhen we come to give a presentation, our aim is to stand out. Nobody goes with the aim to blend into the crowd. But, when you turn on your laptop and project the same standard PPT with a standard Helvetica / Calibri / Times New Roman font,...